JOLTS as Hinge: How Labor Data Splits Equity and Bond Channels
Trace Korea’s 895T Fab MOU and Hammack’s AI call to their respective channels. VIX-MOVE inversion confirms the divergence.

Insights age like wine; news ages like milk.
The evidence below is a timestamp of a recurring cycle.
Observe the mechanism before it repeats.

1. Eternal Logic
When labor market data confirms job openings exceed available workers, equity markets read the signal as corporate earnings support and bond markets read the same signal as Federal Reserve tightening extension. A sovereign capex commitment advancing to a legally binding form further reinforces the equity channel. A central bank official identifying a dominant demand theme as a structural inflation input then reinforces the equity channel and accelerates the bond tightening channel simultaneously. Together, three signals converge on equities in the same direction while two signals drive bonds in the opposite direction. VIX declining and MOVE rising within the same session is the observable confirmation of this structure.
2. The 2026-06-30 Case Study: Empirical Proof
Background
Bank of America and Wells Fargo each raised semiconductor equipment price targets before the June 29 open. Both cited 2026 wafer fabrication equipment spending projections above $140 billion. Firmus confirmed an eight-year 170,000-GPU partnership with NVDA at the open, confirming AI capex demand remained structurally intact. In South Korea, the President announced the national semiconductor megaproject. SOX gained +3.83% on June 29.
Morgan Stanley published a note dated June 30 projecting 4.8 million barrels per day of excess supply in 2027. The bank lowered its Brent crude targets for Q3 and Q4 2026 from $90 and $80 to $75 per barrel, citing faster-than-expected Hormuz flow recovery. Physical supply was already normalizing faster than diplomatic resolution. Meanwhile, at 5:44 a.m. Eastern Time, Iran’s Foreign Ministry confirmed that no US-Iran negotiation meetings were scheduled at any level in the coming days. Supply restoration was outpacing formal diplomatic progress.
Trigger
South Korea’s June 29 megaproject declaration advanced to a legally binding inter-ministerial agreement on June 30. South Korea’s Ministry of Trade, Industry and Energy convened the National Report on Southwest Advanced Industry Development. SK committed 470 trillion KRW to construct two memory fabrication plants and a 1GW AI data center in South Korea’s southwest region. Samsung Electronics committed 425 trillion KRW to construct two memory fabrication plants and a national AI computing center. Total committed capital reached 895 trillion KRW. SK hynix, Samsung Electronics, and five South Korean government ministries signed a formal Memorandum of Understanding at the event. The government committed to covering up to 100% of infrastructure costs for power, water, and land at the new fabrication sites. Permitting and site preparation timelines shortened from a standard decade-long process to under five years. South Korea’s President chairs the Semiconductor Special Committee established under the Semiconductor Special Act to oversee implementation.
At 10 a.m. Eastern Time, the US Department of Labor released the May Job Openings and Labor Turnover Survey. Job openings reached 7.594 million, exceeding the consensus estimate of 7.30 million by 294,000 positions. The job openings ratio rose to 1.039, the second consecutive month above 1.0. The reading represented the highest level since May 2024. A job openings ratio above 1.0 signals that labor demand exceeds labor supply. That imbalance sustains wage pressure and extends the Federal Reserve tightening horizon.
Transmission and Market Confirmation
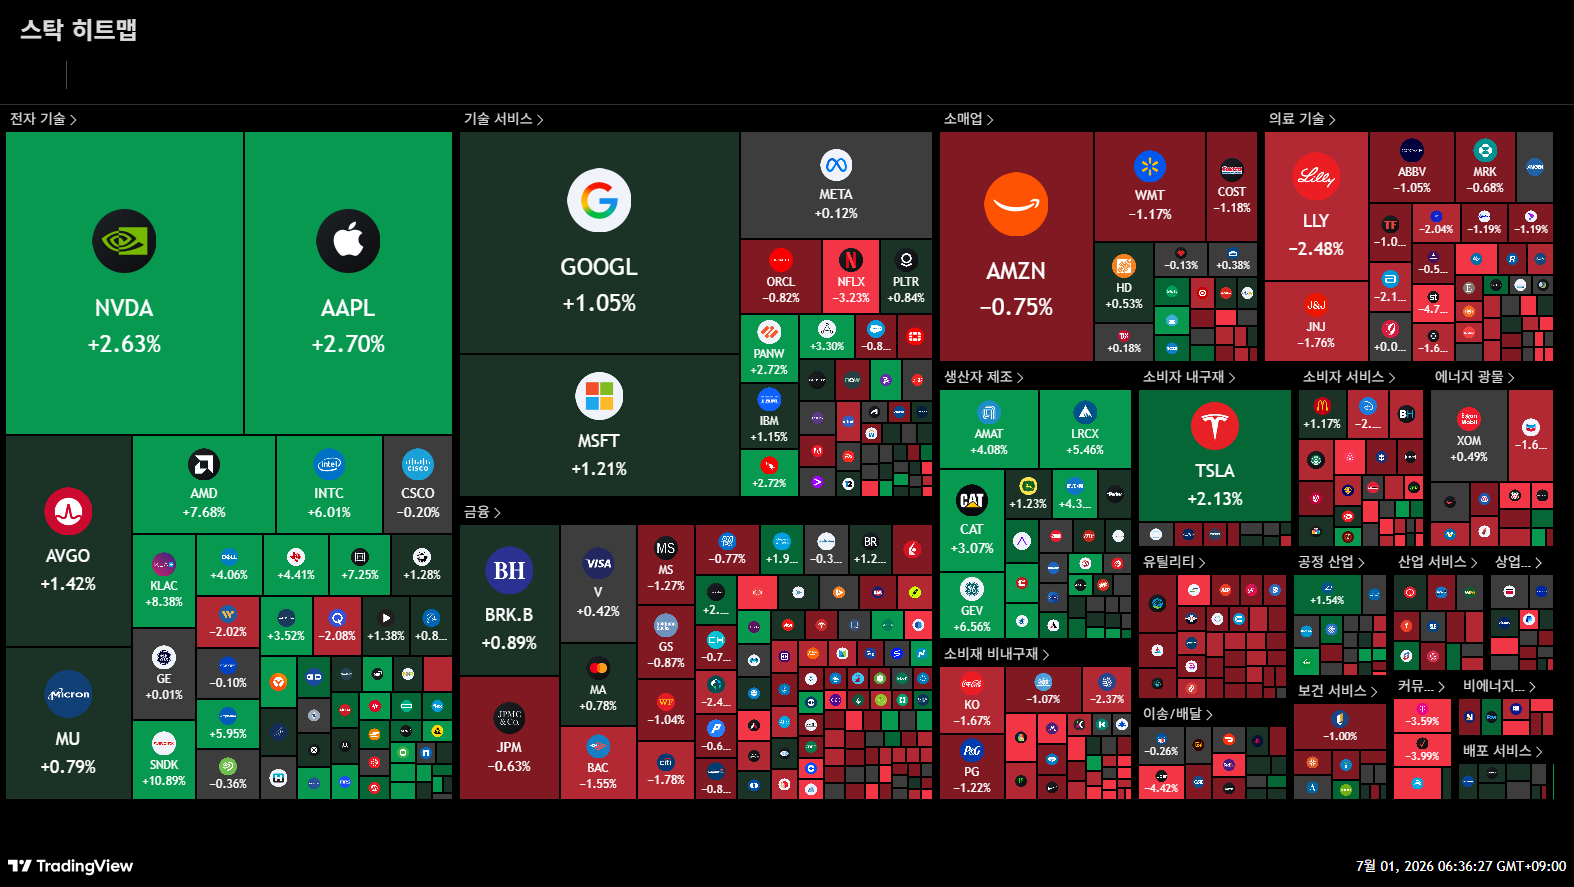
South Korea’s southwest MOU converted fabrication capacity commitments into quantifiable order pipelines for semiconductor equipment suppliers. Equipment vendors receive orders at the first stage of new fab construction, ahead of materials suppliers, substrate makers, and systems integrators. That sequencing concentrated initial capital into equipment names. KLAC gained +8.38%, AMAT gained +4.20%, and ASML gained +5.63%. Each ranked among the top performers in SOX for the session. The equipment buying transmitted downstream into semiconductor end markets. NVDA gained +2.54%, AMD gained +7.62%, and INTC gained +5.95%. SOX closed +3.92%, with 28 of 30 index constituents advancing. XLK gained +2.76% and NDX gained +1.69%.
South Korea’s southwest MOU and the JOLTS reading both drove equity buying. The MOU drove equipment order demand. The JOLTS reading confirmed labor market strength, supporting the corporate earnings base.
Simultaneously, the JOLTS reading signaled that labor demand would remain above labor supply, sustaining wage pressure and extending the Federal Reserve tightening horizon. The CME FedWatch no-change probability fell from 19.6% to 17.3%. One-increase probability declined from 41.0% to 39.6%. Two-increase probability rose from 29.6% to 31.5%. Rate reduction probability held at 0%.
That afternoon, Cleveland Federal Reserve President Beth Hammack further reinforced the tightening signal in a CNBC interview. She addressed both the labor market and AI infrastructure. She stated that conditions approached full employment and that rate increases warranted active consideration. She identified AI infrastructure demand as a direct inflation input, stating that hyperscalers would pay any price for inputs and needed capacity built immediately. Her AI capex remarks reinforced equity demand and simultaneously extended the bond market tightening signal. Her remarks arrived during the afternoon and accelerated the rate rise already in progress.
The JOLTS reading and the Hammack interview drove Treasury selling across all maturities. Energy-driven near-term inflation and labor market strength operate as structurally distinct inputs. Near-term inflation shifts short-end pricing. Labor market strength shifts the full rate cycle horizon. On June 30, labor market strength extended the rate increase path across all maturities. Long-end selling exceeded short-end selling. The 10-year Treasury yield rose +9.0bp to 4.467%. The 30-year yield rose +9.1bp to 4.951%. The 2-year yield rose +6.1bp to 4.170%. The 10-year to 2-year spread widened from 26.50bp to 29.7bp. Bear steepening occurs when long-end yields rise faster than short-end yields within the same rate cycle. Short-end yields respond primarily to near-term policy rate expectations. Long-end yields respond to both policy rate expectations and long-run inflation expectations. The JOLTS reading signaled that labor demand would remain above labor supply for an extended period. The Hammack interview identified AI capex demand as a structural inflation input. Both signals raised long-run inflation expectations above the near-term rate path adjustment. That additional pressure on the long end drove the spread wider.
Curve direction identifies which input is driving Treasury selling. On June 29, energy-driven near-term inflation expectations concentrated selling in short-end maturities. The 2-year yield rose +1.5bp while the 30-year yield fell -0.5bp. The 10-year to 2-year spread compressed from 27.80bp to 26.50bp. The two inputs produced opposite curve responses in successive sessions.
Outcome
AI capex confirmation and labor market strength drove equity buying. S&P 500 closed +0.78% at 7,498.79. NDX closed +1.69% at 30,276.35. SOX closed +3.92%. VIX settled at 16.45.
Labor market strength and AI capex inflation extended Treasury selling across all maturities. The 10-year yield settled at 4.467%, the 30-year at 4.951%, and the 2-year at 4.170%. The 10-year to 2-year spread settled at 29.7bp in bear steepening. MOVE rose to 71.96.
VIX and MOVE moved in opposing directions within the same session. Under standard conditions, equity volatility and bond volatility move in the same direction. Opposing movement within a single session indicates that the two markets responded to separate and structurally distinct input variables. The first half of 2026 closed with equity volatility compressed and bond volatility elevated. That divergence reflects a market structure where two independent input variables acted on two separate asset classes in opposite directions simultaneously.
Cross-Market Comparison: Korean Session
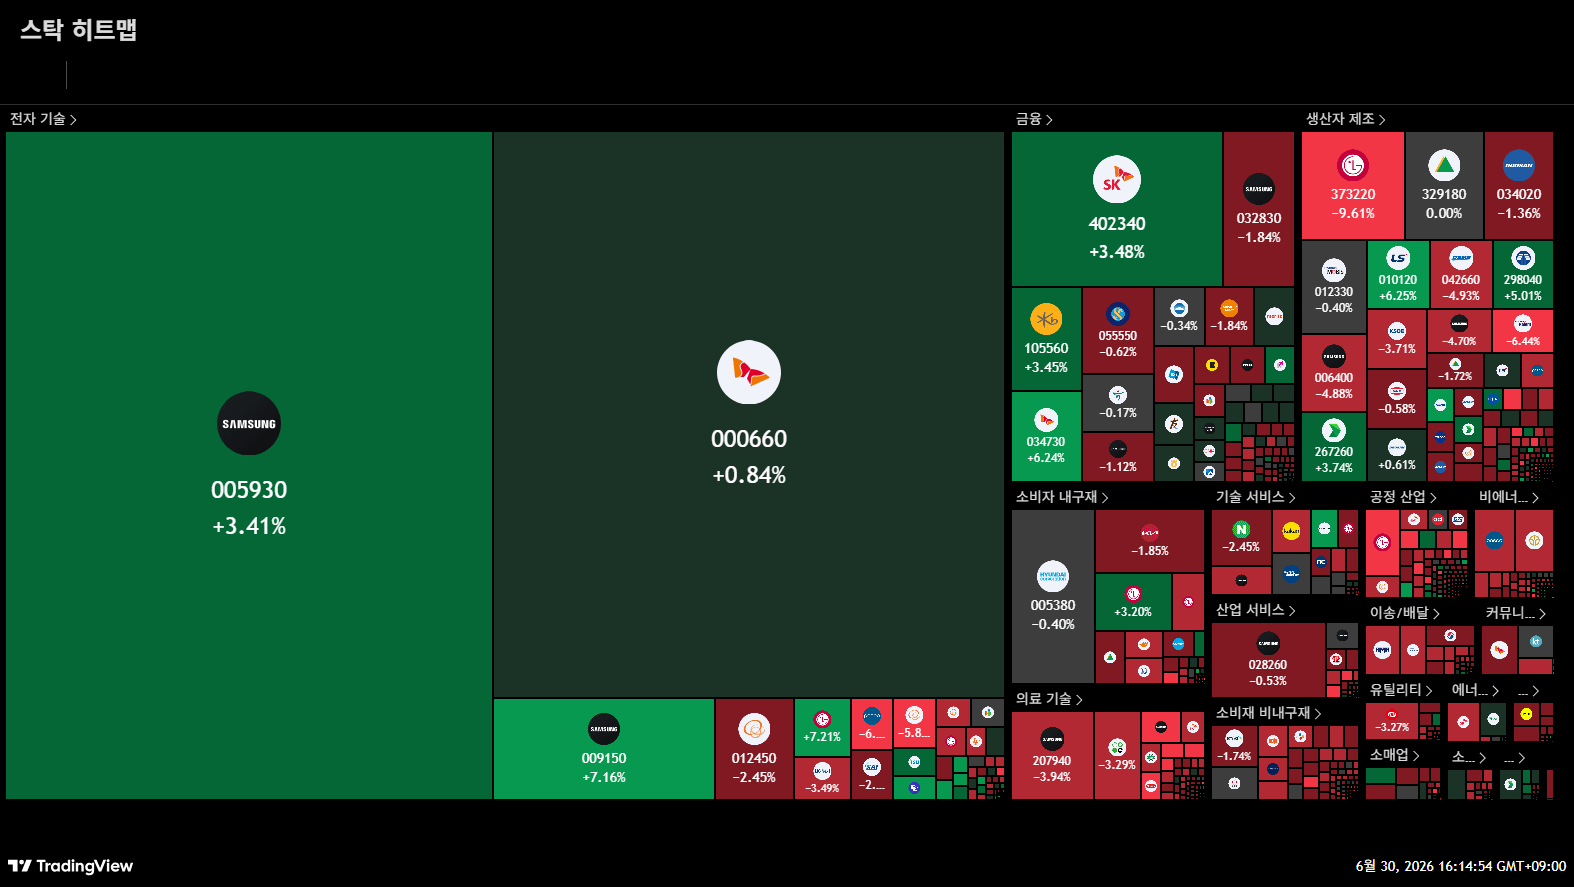
The megaproject on June 29 and South Korea’s southwest MOU on June 30 both confirmed fabrication expansion commitment. Capital moved away from memory chip end-market positions and toward fab construction equipment positions.
Semiconductor equipment suppliers tied to new fab construction led the rally in broader price action. KC Tech gained +26.62%, PSK Holdings gained +18.78%, Jusung Engineering gained +13.82%, and Wonik IPS gained +5.72%. Jusung Engineering posted the largest single-stock trading value on the KOSDAQ that session. On June 30, ASML gained +5.63%, KLAC gained +8.38%, and AMAT gained +4.20% in the US session.
Foreign accounts on June 30 sold Samsung Electronics for a net 873 billion KRW and SK hynix for a net 1.58 trillion KRW. Wonik IPS, a deposition equipment supplier for new fabrication lines, received net buying of 884 billion KRW. EO Technics, a laser processing equipment supplier for semiconductor production, received net buying of 92 billion KRW.
The southwest MOU event began at 3 p.m. Korea Standard Time, thirty minutes before the KOSPI close. June 30 Korean equity flows reflected only the June 29 megaproject.
3. The Structural Filter: Identifying the Mechanism Across Cycles
The pattern is active when the job openings ratio exceeds 1.0 in consecutive readings, a sovereign capex commitment advances from policy declaration to a legally binding form, and a central bank official identifies a dominant demand theme as a structural inflation input. Once those conditions are present, upstream supply chain suppliers lead a sector index in the same session, long-end Treasury yields rise faster than short-end yields, and VIX falls while MOVE rises. Signal strength reduces, however, when the capex commitment holds at the policy declaration stage, when the job openings ratio strength appears in a single reading, or when the central bank official treats the demand theme as a temporary rather than structural input. The pattern fully invalidates when VIX and MOVE move in the same direction, or when subsequent labor market data revises the job openings ratio below 1.0.
This content is for informational and educational purposes only and does not constitute financial, investment, tax, or legal advice. Past performance is not indicative of future results. All investments involve risk, including possible loss of principal. Consult a qualified advisor before investing. Author may hold positions in discussed securities.
If this research helps you read the market, consider subscribing.
Your support helps me keep doing this work.
[Pre-Market Audit]
Pre-market thesis below.

The VIX-MOVE inversion is the most actionable signal in the piece because it tells you the two markets are running on different operating systems from the same data input. Equities read strong JOLTS as earnings support. Bonds read the same number as tightening extension. Both readings are internally consistent and they can't both be right indefinitely, because higher rates eventually choke the earnings the equity market is pricing. The inversion is a clock. It measures how long the divergence has been running, and the convergence, when it comes, resolves through either equities selling into the rate reality or bonds rallying into a growth slowdown. One of them capitulates. The VIX-MOVE spread tells you neither has yet.
The Hammack detail is where the two channels become one. AI capex sustains corporate earnings and drives structural inflation simultaneously. The same dollar spent on a data centre shows up as revenue in the equity channel and as inflationary pressure in the bond channel. That's not two separate signals. It's one signal read by two markets through different lenses, and the VIX-MOVE inversion is the observable proof that neither market has acknowledged the other's reading.